Climate data - Links
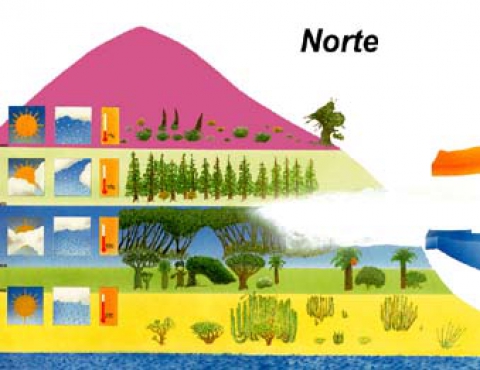
The climate of Tenerife is also influenced by winds, especially the prevailing N.E. trades, whose moisture condenses on the North and North East foothills of the Island, forming extensive seas of cloud. These are located between approximately 600 and 1,800 metres above sea level; the upper boundary is limited by the circulation of higher altitude, dryer and warmer air, which usually prevents the clouds from rising above the zone of temperature inversion (See diagram).
The sporadic appearance of atmospheric disturbances temporarily modifies this pattern, giving way to hot, dust-filled winds or torrential rain that can fall as snow in the mountains. Moreover, the rugged terrain of Tenerife can modify general weather conditions locally, generating a rich variety of micro-climates.
Climate data
The first table shows average daily sunshine (hours of sunshine) in four weather stations on the island, and the second table shows average monthly and annual temperatures in the same weather stations. A third table shows average annual rainfall in six weather stations and finally there is a series of interesting links.
| AVERAGE DAILY HOURS OF SUNLIGHT |
| Month |
Santa Cruz |
Aerop. Sur |
Aerop. Norte |
Izaña |
| January |
5.8 |
6.1 |
4.9 |
6.9 |
| February |
6.6 |
6.6 |
5.9 |
8.2 |
| March |
7.1 |
6.8 |
5.9 |
9.1 |
| April |
8.0 |
6.5 |
6.1 |
9.0 |
| May |
9.2 |
7.5 |
6.5 |
10.5 |
| June |
10.2 |
7.6 |
7.8 |
12.4 |
| July |
11.0 |
8.4 |
8.6 |
10.8 |
| August |
10.5 |
8.0 |
8.6 |
10.8 |
| September |
8.3 |
6.2 |
7.4 |
9.1 |
| October |
6.7 |
6.5 |
6.1 |
8.4 |
| November |
5.9 |
5.9 |
5.4 |
7.2 |
| December |
5.4 |
6.2 |
4.6 |
6.6 |
| AVERAGE |
7.9 |
6.9 |
6.4 |
9.0 |
| AVERAGE MONTHLY AND ANNUAL TEMPERATURES (in ºC) |
| Month |
Santa Cruz |
Airport TF SOUTH |
Airport TF NORTH |
Izaña |
| January |
17.2 |
18.4 |
12.2 |
4.0 |
| February |
17.9 |
18.2 |
12.5 |
4.3 |
| March |
18.6 |
19.3 |
13.2 |
5.7 |
| April |
19.1 |
19.3 |
13.4 |
6.7 |
| May |
20.3 |
20.2 |
14.6 |
9.5 |
| June |
22.1 |
22.0 |
16.0 |
13.4 |
| July |
24.3 |
24.0 |
18.5 |
17.5 |
| August |
24.9 |
24.8 |
19.4 |
17.5 |
| September |
24.2 |
24.8 |
19.1 |
14.0 |
| October |
22.8 |
23.6 |
17.6 |
10.1 |
| November |
20.5 |
21.5 |
15.4 |
7.2 |
| December |
18.5 |
19.5 |
12.9 |
4.3 |
| AVERAGE |
20.8 |
21.3 |
15.1 |
9.5 |
| AVERAGE ANNUAL RAINFALL |
| Place |
Altitude (m) |
Annual (mm) |
Days more than 0.1 mm |
| Santa Cruz de Tenerife |
36 |
243,5 |
50,8 |
| Punta de la Rasca |
- |
95,7 |
10,8 |
| Airport TF SUR |
- |
125,7 |
- |
| Airport TF NORTE |
617 |
661,2 |
85,2 |
| Icod de los Vinos |
200 |
449 |
71,3 |
| Observatorio del Teide (Izaña) |
2367 |
532,6 |
45,7 |
Calculando ...
Votos(s): 27. Resultado: 4.7


